Many organizations create a single or multi page chart containing a mixture of relevant projects and activities which is called a Mind Map, this is useful as a general visualisation tool.
However, a Strategy Map displays only pure strategy in a layered format for the purpose of demonstrating Progressive Core Business operations to relevant stakeholders and managers.
It is the definition for and is backed up by a Structured Information System called the Balanced Scorecard which has relevant employee components.
The Strategy Map Objectives are then cascaded into the Balanced Scorecard table which contains targets & measures which are used to define the Strategic Alignment.
Discover Organisational Visual Strategic Planning using Strategy Maps.
Every Organisation needs to do Visual Strategic Planning to define: Operational Themes, Strategy Maps, Perspectives and Objectives. These cascade down to the Balanced Scorecard and Initiatives Grids with averaged feedback progress gauges.
The Strategy Map Must Align with the Visionary Statements, but the primary theme is Creating Profit.
A Strategy Map is not a "Mind Map", because it is carefully structured as a layered, aligned and measured Organisational Directional Tool.
Creating your Organisational "Strategic Picture".
Creating a good well structured, balanced & neat Strategy Map is an 'Bigger Picture Art Form' which takes practice.
The final form is often achieved through successive approximation and may later require adjustments or additions.
Strategic Picture = Primary Strategic Visionary Statements + Perspective Aligned Flow Chart + 3rd Generation Objective destination statements
When completed correctly it provides the structured organizational drive that is essential in today's competitive business world.
The Strategic Strategy Map is a collection of Bigger-Picture Value-Chains.
These try to share broad-scope Objectives to enable drill-down collaboration.
Without this, your organization has no real basis for defining KRA's/KPI's, Measures and Scores. Plus no Stakeholder Report data.
The Strategic Strategy Map is a collection of Bigger-Picture Value-Chains.
These try to share broad-scope Objectives to enable drill-down collaboration.
Without this, your organization has no real basis for defining KRA's/KPI's, Measures and Scores. Plus no Stakeholder Report data.
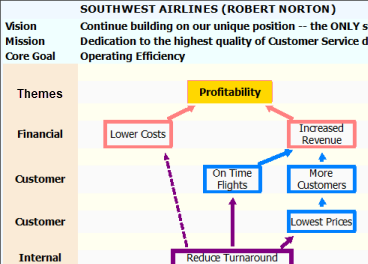
The Perspectives Row Headers contain all your Themes and Objectives and must be compatible with your Visionary Statements.
At the top there may be a Themes row, but there are usually 4 standard Perspectives: Customer, Finance, Internal-Process and Development.
Most Strategy Maps contain variations on these four rows, plus they can be repeated on additional rows.
Sometimes one or two special-purpose "Feature Perspectives" are added. For Example "Operational Excellence" or "Safety".
Most Strategy Maps contain variations on these four rows, plus they can be repeated on additional rows.
Sometimes one or two special-purpose "Feature Perspectives" are added. For Example "Operational Excellence" or "Safety".
Strategy Maps usually have the final strategic targets on the top row which for most organizations is usually the Themes or Customer.
The Perspectives Row Headers contain all your Themes and Objectives and must be compatible with your Visionary Statements.
The maps mostly have arrows pointing up as this implies success stability and growth.
The arrows represent the Strategic Flow and when you focus on any one objective there should be a clear 'Strategic-Value-Chain'.
The maps mostly have arrows pointing up as this implies success stability and growth.
The arrows represent the Strategic Flow and when you focus on any one objective there should be a clear 'Strategic-Value-Chain'.